


fs4000us_scan_tab3


Follow me:


WildestDreams FS4000US Scan Application
Help page for the WDS Scan Application: "Define Scan Mode" tab
|
This definitly is the most difficult part of WDS. The magical numbers on this tab page control the gain of the sensors of your scanner. Best way to proceed is to take these default settings, make a scan (recommended at 500 DPI) and look at the histogram and your favorite imaging tool (from now on, I will assume Photoshop) to assess the scan. Depending on the color bias you get, these numbers need to be revised. Simply change values until you are satisfied with the result (i.e. a pleasing tonal range). |
Printscreen of tab "Define Scan Mode"
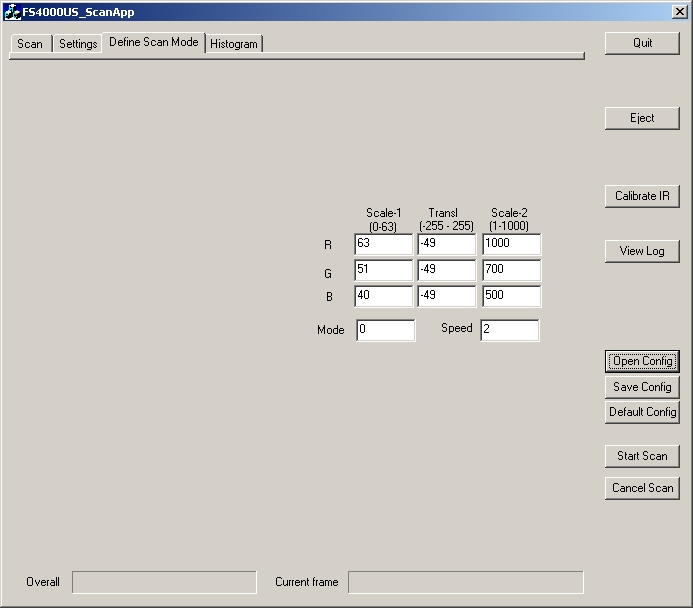
Explanation
|
The FS4000US contains a lamp which illuminates the slide. On the other side of the slide, there are some sensors that measure the Red, Green and Blue light that passes the slide. Combined this makes a pixel in the scan. The scan also depends on the Speed setting, the lower this value the faster the scan will be finished. A larger value will slow the scanning down, however the quality of the image will improve a bit. The ammount of light that the lamp provides is constant. The sensitivity of the Red, Green and Blue sensors can be changed. This process is similar to the Levels tool in photoshop. This sensitivity is what we define in this screen. Value = (sensorvalue * speed * scalefactor2 + translatefactor)* scalefactor1 |
|
It is very important to get the settings right because if a scan is made using correct settings then you will notice that the finetuning in photoshop afterwards is reduced to a very easy task. You might even notice that some scans do not need any adjustments at all and that auto-levels sometimes does a great job as well. Even the scans with an explicit colorcast (sunset) will look vivid (and not dull; the result you get from other scan applications). |
|
Start with a well-exposed slide that has a lot of colors, for which it is easy to spot a colorcast. Scan this slide and look at the histogram (use the Histogram Tab of the Scan Application). If the histogram has a lot of pixels at the start or the end of the histogram (also known as clipping), then you need to change the values. Suppose you get this histogram: 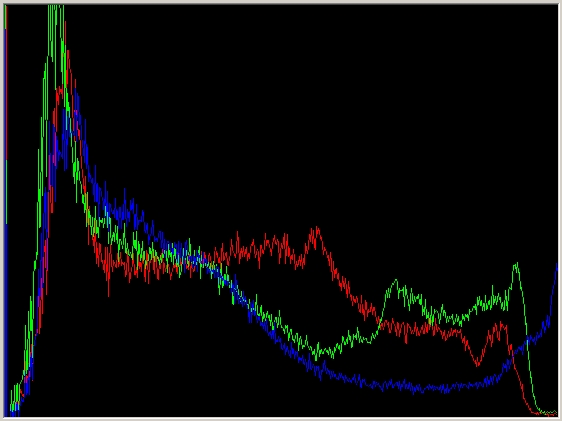
The Blue channel seems not OK since a lot of blue is clipped. Therefore reduce scalefactor1 or scalefactor2 for BLUE and scan again. Halving or doubling one of the scalefactors will half or double the width of the histogram. From the example above, a decrease of one of the the scalefactors for Blue of 20 percent seems appropriate (of decrease both scalefactrs with 10 percent). Another example is this: 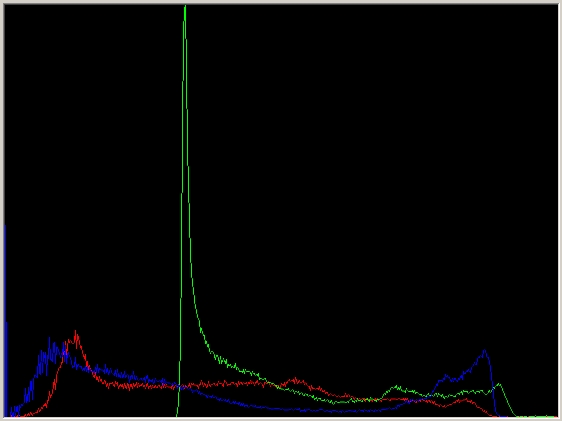
The histogram does not show clipping, but the intensity of the R/G/B channels seem misaligned. This can be solved by changing the translate factor. In this example it seems as if the Green channel needs to be translated. The translation must be expressed in a range from -50 to 50, which corresponds roughly with a translation of -20 to +20 percent of the histogram. From the example above, the green channel should be translated with -70. Watch the mimimum value for the Green translation though: translation should be between -49 and +49. When we are satisfied with the histogram then proceed to the image itself. Open the scanned image in your imaging tool and look at the picture. Probably your scan has a color-bias. Use Levels in Photoshop to get an indication of the problematic color. Make small adjustments to the scan settings and rescan. Repeat this last step until you are satisfied with the result. |
|
Suppose you get this histogram. 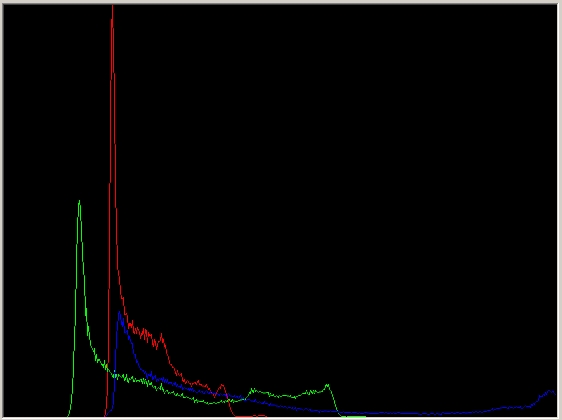
Think for yourself what should be changed Answer: 1. First modify the scalefactors such that the histogram does not show clipping. 2. Then proceed with translation. Repeat this until you have a result with a good histogram.
|